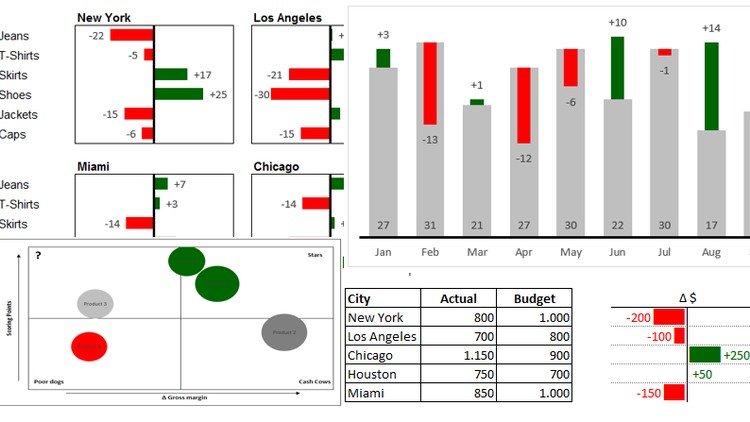
Are you looking to elevate your Excel skills and create dynamic dashboards that effectively communicate data insights? The "Dashboards with Excel" course on Udemy is designed to help you master this essential skill, whether you’re a complete novice or have some experience under your belt. With practical examples and a hands-on approach, you can bring your data to life in a visually appealing way that enhances decision-making. Let’s dive into the details of what this course offers!
What you’ll learn
In this course, you’ll acquire a robust set of skills necessary for creating interactive and visually compelling dashboards. Key learning outcomes include:
- Data Visualization Techniques: You’ll learn how to represent data visually, using various types of charts and graphs that make complex information more digestible.
- Pivot Tables and Charts: Understand how to analyze data efficiently and summarize it using pivot tables, which serve as the foundation for most dashboards.
- Formulas and Functions: Gain hands-on experience with essential Excel formulas (like VLOOKUP, IF statements, and dynamic ranges) that help automate calculations and improve data integrity.
- Dynamic Dashboard Elements: Learn to create interactive dashboard components such as drop-down lists and slicers, allowing users to filter and manipulate data smoothly.
- Best Practices: The course emphasizes design best practices, helping you understand how to layout dashboards for optimal user engagement and readability.
This comprehensive skillset enables you to transform raw data into actionable insights, making it easier to convey critical information to stakeholders.
Requirements and course approach
The course is designed with accessibility in mind, making it open to a range of learners, from total beginners to individuals with intermediate Excel experience. Here are a few prerequisites and aspects of the course structure:
- Basic Excel Knowledge: A fundamental understanding of Excel is helpful, as the course dives into specific functionalities and techniques.
- Excel Software: You will need access to Microsoft Excel (preferably Excel 2016 or later) to follow along with the course material.
- Learning Methodology: The course is structured around a hands-on, project-based learning approach. Each module builds on the previous one, and you’ll apply your knowledge in real-world scenarios to reinforce what you’ve learned. Expect practical assignments that challenge you to apply techniques immediately.
Through a combination of video lectures, downloadable resources, and ongoing support through discussion forums, you’ll find a welcoming learning environment.
Who this course is for
The "Dashboards with Excel" course is suitable for a variety of professionals and students, including:
- Business Analysts: Professionals looking to enhance their data reporting capabilities.
- Marketing and Sales Teams: Individuals who need to present key metrics and KPIs in an engaging format.
- Students and Educators: Those wanting to enhance presentations and reports with interactive dashboards.
- Anyone Interested in Data Visualization: Whether you’re a small business owner or a data enthusiast, this course will equip you with the tools needed to convey data effectively.
If you have a passion for leveraging data to make informed decisions or whimsically create visual masterpieces out of raw numbers, this course is tailored for you!
Outcomes and final thoughts
By the end of the "Dashboards with Excel" course, you will be equipped to design and implement effective dashboards that make decision-making simpler and more intuitive. Not only will you enhance your Excel skills, but you’ll also gain confidence in presenting data visually, a crucial asset in today’s data-driven world.
Ultimately, this course stands out for its practical focus and clear instruction. You’ll emerge with not just theoretical knowledge but also applicable skills ready to face real-world challenges. Whether you aim to boost your career or simply enhance your personal projects, mastering the art of dashboard creation in Excel is a valuable and rewarding skill. So why wait? Dive in and start transforming your data experiences today!


