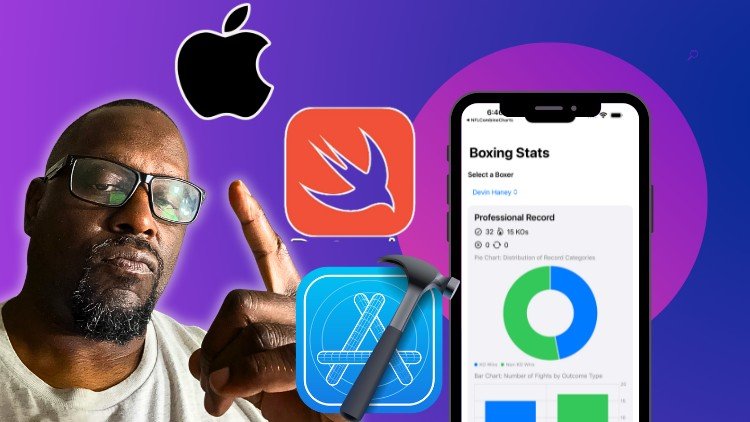
If you’re looking to enhance your iOS development skills, particularly in creating data-driven user interfaces, "Swift Charts for iOS Developers: Build Better Data-Driven UI" on Udemy provides an excellent opportunity. This course is tailored for both beginners and those with some experience in iOS development. Here’s a comprehensive review to help you decide if it’s the right fit for you.
What you’ll learn
In this course, you’ll dive deep into the world of data visualization with Swift Charts. The main skills and technologies you will master include:
- Chart Basics: Understand the foundational concepts of charts, including types, components, and how they convey information visually.
- SwiftUI Framework: Gain proficiency in using SwiftUI to create visually appealing and dynamic user interfaces.
- Data Binding: Learn how to effectively bind data to your charts, ensuring that your UI updates as data changes.
- Customizing Charts: Discover techniques to customize your charts, from colors and labels to complex visual representations tailored to your needs.
- Performance Optimization: Understand how to ensure your chart-driven UI remains efficient, even with large datasets.
- Real-world Examples: Work on engaging projects that simulate real-world applications, providing you practical experience in chart implementation.
By the end of the course, you’ll have a solid foundation in using Swift Charts to create compelling interfaces that effectively showcase your data.
Requirements and course approach
The course requirements are minimal but essential. You should have a basic understanding of Swift programming and familiarity with Xcode and the iOS development environment. No prior knowledge about charts is necessary, making this accessible for beginners.
The instructor adopts a hands-on approach, blending theoretical knowledge with practical exercises. Courses are structured into bite-sized video lectures, making it easy to follow along and absorb the material. You’ll also find quizzes and coding assignments that reinforce learning, providing immediate feedback on your progress.
Who this course is for
This course is ideally suited for:
- Aspiring iOS Developers: If you’re new to iOS development and want to incorporate data visualization into your skill set, this course is perfect for you.
- Intermediate Developers: Those who already have a handle on Swift and want to deepen their knowledge of UI development and data visualizations will find valuable insights here.
- Designers Collaborating with Developers: If you’re in a role that involves collaboration with developers and want to understand how to better work with data-driven UI, you’ll benefit from the concepts covered.
- Tech Enthusiasts: Anyone interested in Swift development and looking to expand their project repertoire will find this course rewarding.
Outcomes and final thoughts
Upon completion of "Swift Charts for iOS Developers: Build Better Data-Driven UI," you can expect to have acquired a robust skill set in crafting data-driven interfaces. You’ll be able to confidently implement various types of charts in your applications, enhance user experience with visually rich data presentations, and improve your overall iOS development portfolio.
In conclusion, this course stands out for its practicality and the engaging approach the instructor takes. Whether you’re just starting out or looking to polish your skills, "Swift Charts" offers a comprehensive guide that will empower you to create better, more dynamic applications. If you are passionate about iOS development and eager to elevate your user interface game, this course is well worth your time and investment.


