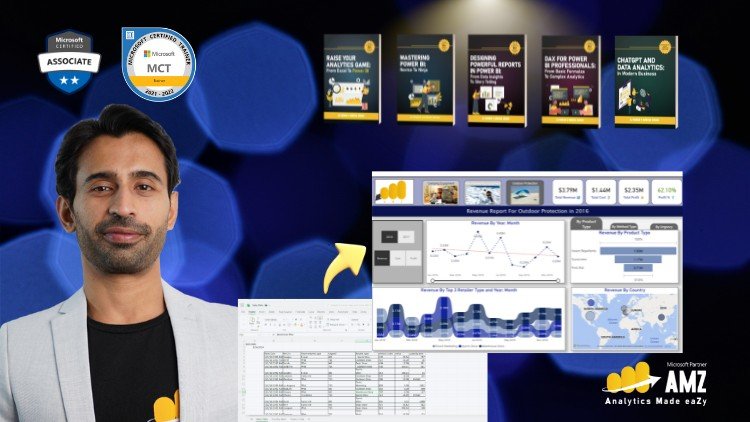
If you’re eager to delve into the world of data visualization and analytics, "Microsoft Power BI for Beginners & Excel Users" is an excellent course to consider. Offered on Udemy, this course is tailored to help both novices and those familiar with Excel harness the full potential of Power BI, Microsoft’s powerful business intelligence tool. Whether you’re looking to enhance your data storytelling skills or make informed business decisions based on solid analytics, this course is designed to equip you with the essential techniques and insights.
What you’ll learn
In this course, you will acquire a host of valuable skills that are critical for effective data analysis and visualization. Here are the main areas covered:
- Understanding Power BI Basics: Get familiar with the interface and fundamental concepts of Power BI.
- Data Importing Techniques: Learn how to import data from various sources, including Excel, databases, and online services.
- Data Transformation: Master Power Query to transform and clean your data for better analysis.
- Data Modeling: Understand relationships between different data sources and how to create a coherent data model.
- Creating Visualizations: Explore various visualization types—charts, tables, maps—and how to effectively use them.
- Building Reports and Dashboards: Learn to combine visualizations into interactive reports and dashboards.
- Using DAX (Data Analysis Expressions): Gain insights into writing DAX formulas for more advanced data calculations.
- Publishing and Sharing Reports: Discover how to publish your reports to the Power BI service and share them with others.
These skills will empower you to create insightful reports that can enhance decision-making in your organization or personal projects.
Requirements and course approach
There are minimal prerequisites for this course, making it suitable for a broad audience. Here’s what you need before getting started:
- Basic Computer Skills: Familiarity with using a computer and navigating software.
- Excel Knowledge: A basic understanding of Excel is recommended but not mandatory; however, it will certainly help you relate to certain concepts.
The course adopts an engaging and hands-on approach. It includes:
- Video Lectures: Engaging tutorials that break down complex concepts into easy-to-understand segments.
- Practical Exercises: Interactive exercises and real-world examples to solidify your understanding.
- Quizzes and Resources: Frequent quizzes and supplementary resources to enhance the learning experience and allow you to assess your progress.
This blended methodology guarantees that you will not only absorb theoretical knowledge but also put it into practice right away.
Who this course is for
The course is ideal for a range of learners, including:
- Beginners: Individuals looking to start their journey in data analysis with Power BI.
- Excel Users: Those proficient in Excel who want to transition into Power BI and elevate their data visualization skills.
- Business Professionals: Anyone seeking to leverage data-driven insights for better decision-making in their organization.
- Students and Educators: Individuals in academia looking to broaden their skill set for future career opportunities.
No matter your background, if you have an interest in data and analytics, this course is tailored to meet your needs.
Outcomes and final thoughts
Completing "Microsoft Power BI for Beginners & Excel Users" will not only equip you with fundamental skills but also significantly boost your confidence in handling data-driven tasks. By the end of the course, you will be capable of building interactive reports and dashboards that can provide valuable insights.
In summary, this course stands out for its clear instruction, practical examples, and supportive community. It’s a comprehensive introduction to Power BI that focuses on enabling learners to apply what they learn in real-world scenarios. Whether you’re contemplating a career in data analytics or simply want to enhance your current skill set, investing your time in this course is a decision you won’t regret. Embrace the power of data with Microsoft Power BI!


