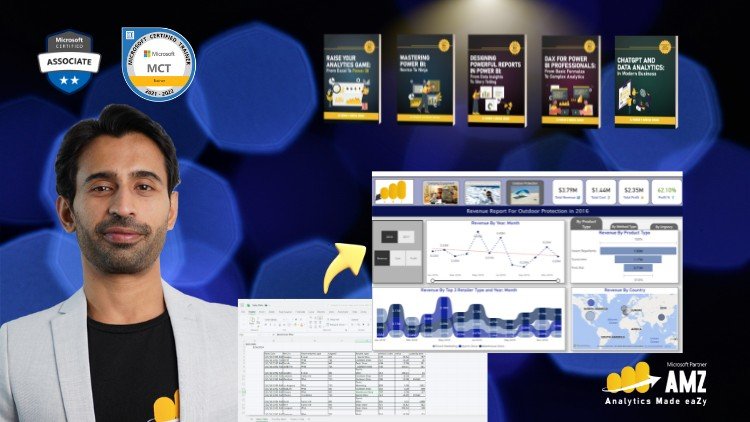
If you’re looking to enhance your data visualization skills and dive into the world of business intelligence, "Microsoft Power BI for Beginners & Excel Users" is an excellent course tailored for individuals eager to harness the power of data. This Udemy course offers a comprehensive introduction to Power BI, making it a great fit for beginners and those familiar with Excel who want to expand their data analysis capabilities.
What you’ll learn
Throughout the course, you’ll gain foundational knowledge and hands-on experience with several essential skills and technologies, including:
- Power BI Interface: Familiarize yourself with the Power BI Desktop interface, enabling you to navigate the tool with confidence.
- Data Importation: Learn how to import data from various sources, including Excel files, databases, and online services.
- Data Transformation: Master the Query Editor to clean and transform your data, ensuring that it is structured for effective analysis.
- Data Visualization: Discover how to create compelling visualizations, such as charts, maps, and tables, to effectively communicate data insights.
- DAX Formulas: Understand the basics of Data Analysis Expressions (DAX) to create sophisticated measures and calculated columns that enhance your reports.
- Publishing Reports: Learn how to publish your Power BI reports and dashboards to the Power BI service, allowing for sharing and collaboration with stakeholders.
This course is a perfect blend of theory and practical application, fostering an understanding of how to leverage Power BI in real-world scenarios.
Requirements and course approach
To make the most of this course, you will need:
- A basic understanding of computers and Microsoft Excel.
- A desire to learn new data visualization techniques, especially if you’re already familiar with Excel but are new to Power BI.
The course adopts a hands-on approach, featuring practical exercises and real-life examples that resonate with daily business situations. Each section builds on the previous one, gradually increasing in complexity, thus ensuring that learners can follow along without feeling overwhelmed. Additionally, the instructor encourages interaction, enabling participants to ask questions and seek clarification promptly.
Who this course is for
This course is designed for:
- Beginners: Individuals with little to no experience in data analysis or Power BI who are looking to build a solid foundation in business intelligence.
- Excel Users: Those who regularly use Excel for data analysis and visualization and want to transition to a more powerful tool that can handle larger datasets and more sophisticated analysis.
- Professionals: Professionals looking to enhance their skills to advance in their careers, particularly in fields such as marketing, finance, and analytics.
Whether you’re a student, an aspiring data analyst, or a seasoned professional wanting to add to your toolkit, this course provides the foundational knowledge necessary to succeed in utilizing Power BI effectively.
Outcomes and final thoughts
By the end of this course, you will be equipped with the skills to confidently create impactful reports and dashboards using Power BI. You’ll be able to transform raw data into actionable insights that can drive decision-making in any organization.
The engaging nature of the instruction, combined with practical exercises, makes this course an invaluable resource for beginners and Excel users alike. The transition from Excel to Power BI opens up new possibilities in data analysis, and this course lays the groundwork for those ventures.
In summary, if you’re ready to take your data analysis skills to the next level and harness the full potential of Power BI, this course is a fantastic starting point.


![Certified Associate Project Management [CAPM] Practice Exams Certified Associate Project Management [CAPM] Practice Exams](https://freewebcart.com/wp-content/uploads/2025/06/6547653_5edc_3-400x225.jpg)
